Colouring in maps – examples of student thinking

I have been working with some 4th grade students, and we have been exploring colouring in maps as per this investigation. Here are a couple of examples of their work.

Example 1
Example 1

Example 2

Example 2

Example 3
Example 3

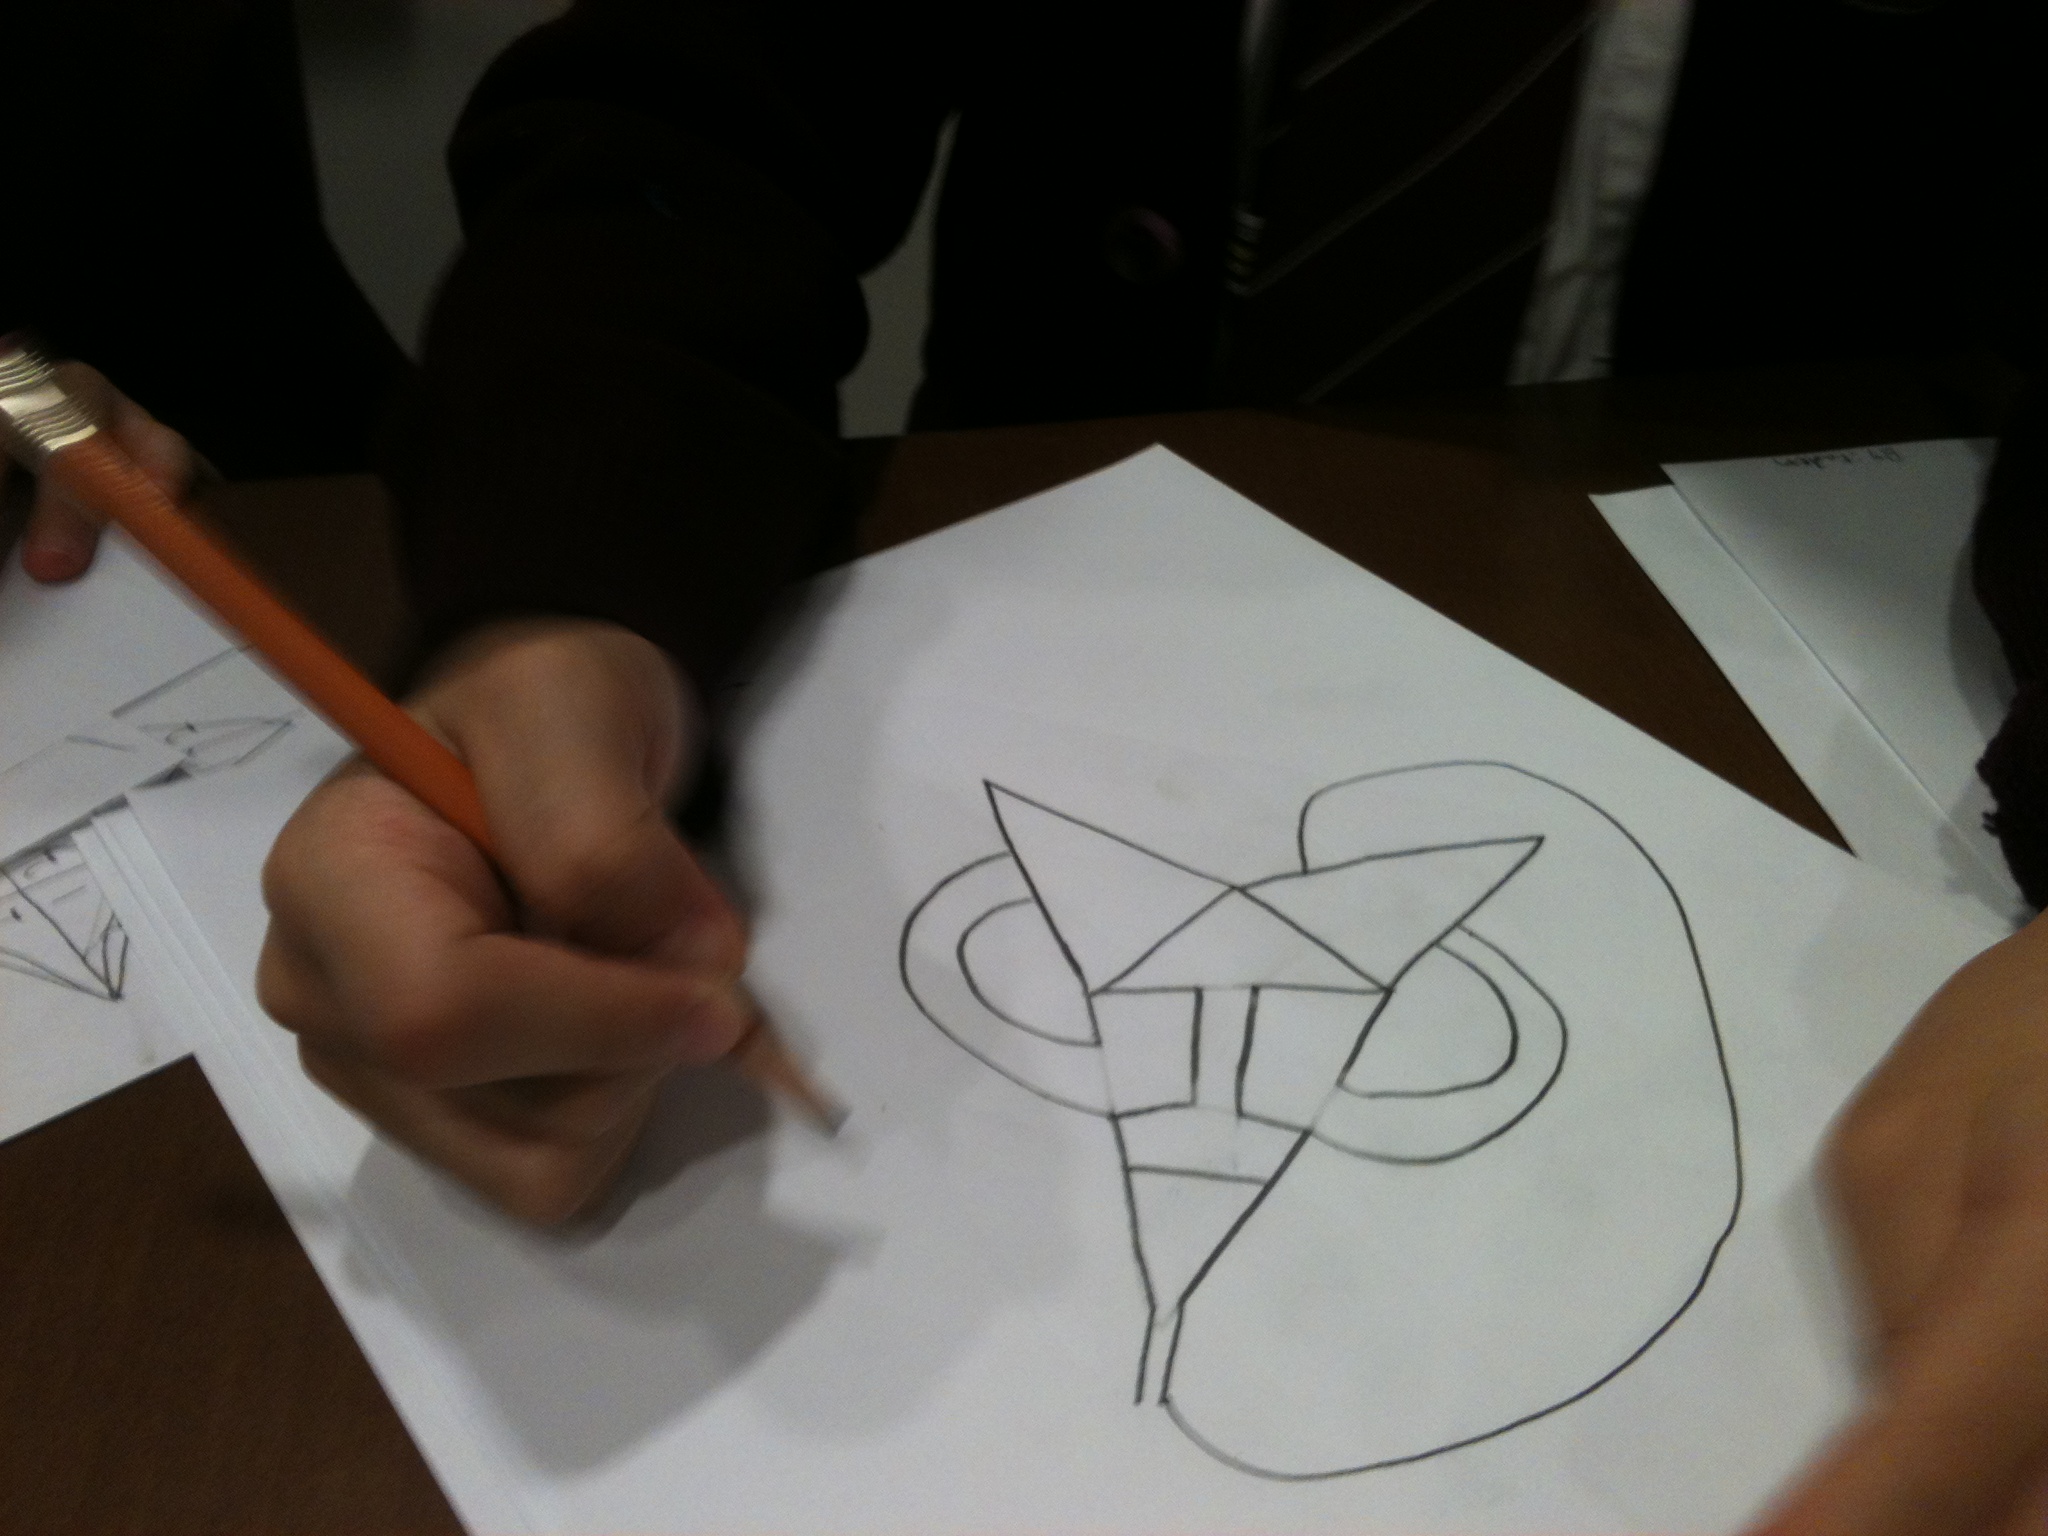
Notice how the students are experimenting with different arrangements of the map. In the last example, the student is trying to find ways to create connections between different “countries” on their map in an effort to force their map to require more colours. Notice also that they have started numbering the colours instead of actually colouring them in. This is a form of abstraction, and something we hope all of our students develop.

Advertisement

Colouring in maps

The purpose of this investigation is to explore what the minimum number of colours is needed to colour in a map so that no two adjacent countries share the same colour. In this case, adjacent countries share a border of more than a point.

Students can start off with a standard map, like a Map of Africa, and begin by experimenting to see what colours work on this map. They could then move to creating their own non-standard maps, and seeing if the minimum still holds. They can also try and investigate what special maps (and their properties) lead to maps that can be shaded with 1, 2, or 3 colours.

The answer to this question is well known, but you should lead students to try and answer a less well known question, why does it work?

Aside: The easiest way I’ve found to actually have students work on this is to download a blank copy of the map of Africa (with the country borders included) and let them use MS Paint (or any other software that works) and let them shade in countries with the program.